Matlab: removing the notebook line from Paint
As a child, many of us drew a lot of paint. Our paint notebook ran out of free paper one day, and we drowned inside a simple vertical notebook. During our image processing course, we will use Matlab to remove vertical lines from the piece of a notebook.
For removing vertical lines inside painting paper, I use two methods:
- The Fourier transform
- Morphology
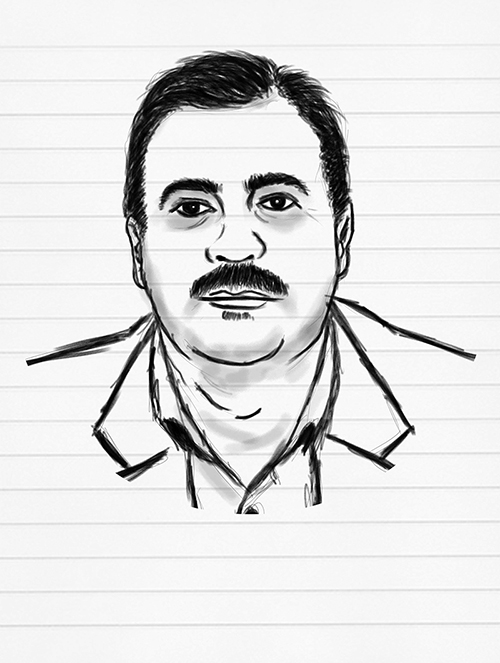
I draw my supervisor’s face with a sketch to use as a sample for working on this task.
Farzin Yaghmaee
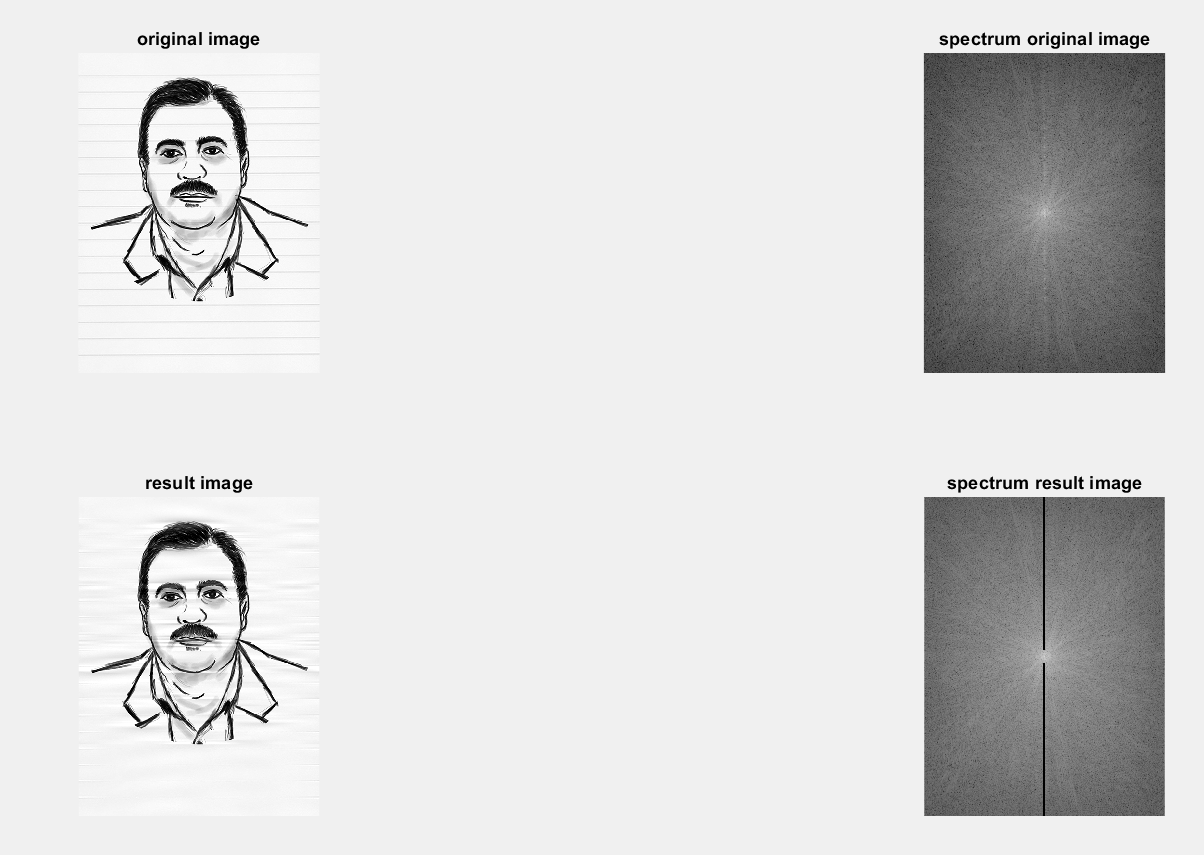
Remove the vertical line inside the painting paper + Fourier transform
Based on the spectrum of the image, the painting lines are located on the vertical line and in the middle. My program blacked out this middle line but left the part of the middle of the spectrum where the rest of the images are intact, as shown above.
clc;

clear all;

close all;

image = imread('paint/paint3.jpg');

image_size = size(image);

temp_image_size = size(image_size);

if(temp_image_size(2) > 2)

image = rgb2gray(image);

end

spec_orig = fft2(double(image));

spec_img = fftshift(spec_orig);

figure;

subplot(2,2,1);

imshow(image);

title('original image');

subplot(2,2,2);

spec_img_temp = log(1 + spec_img);

imshow(spec_img_temp,[]);

title('spectrum original image');

for i = 1 : image_size(1)

if(i > round(image_size(1) / 2 - 15) && i < round(image_size(1) / 2 + 15))

continue;

end

for j = round(image_size(2) / 2 - 2) : round(image_size(2) / 2 + 2)

spec_img(i,j) = 0;

end

end

subplot(2,2,3);

ptnfx = ifft2(ifftshift(spec_img));

imshow(uint8(ptnfx));

title('result image');

spec_orig = fft2(ptnfx);

spec_img = fftshift(spec_orig);

subplot(2,2,4);

spec_img = log(1 + spec_img);

imshow(spec_img,[]);

title('spectrum result image');
result:
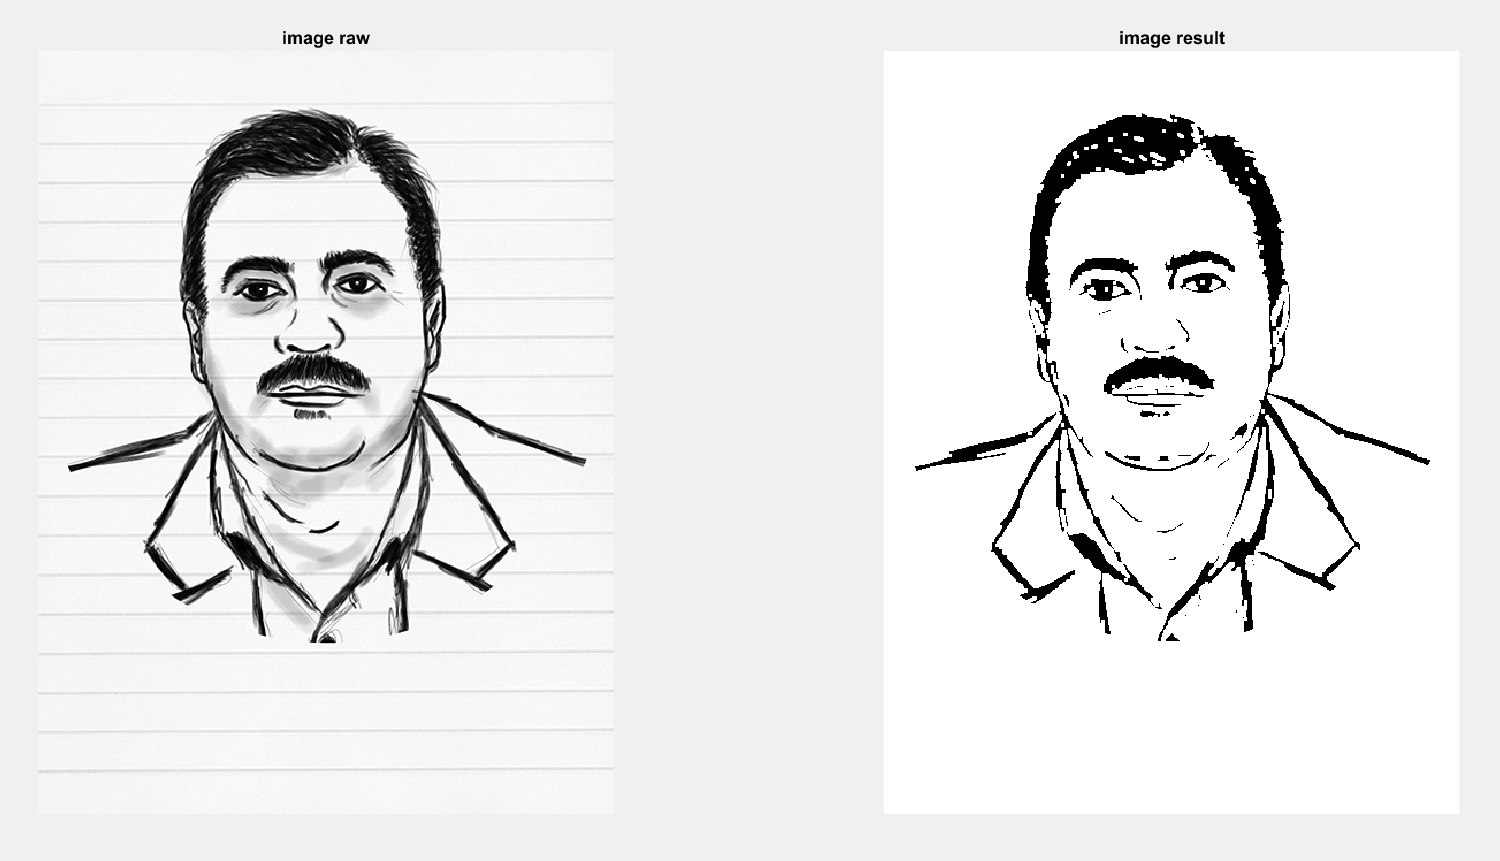
Remove the vertical line inside the painting paper + morphology
In the first step, I converted paint images into grayscale colors. I used the Matlab function rgb2gray to do this.
Next, I convert grayscale images to binary images. A binary image has two values: 0 or 1. I use the binarize function in Matlab to convert these values to binary.
Then, I made three linear windows of the following sizes:
- 3*180
- 2*90
- 5*90
The morphology actions I run are as follows:
- Dilation with a 3*180 linear window.
- Erosion with a 3*90 linear window.
- Dilation with a 5*90 linear window.
Manually selecting and testing these windows. I use imerode for erosion and imdilate for dilation.
As a final step, I tested the median and mean filters inside the resulting image. The results were improved by these filters.
For the median and mean filters, I wrote a personal function.
clc;

clear;

close all;

image_raw = imread('paint/paint.jpg');

image_paint = image_raw;

image_size = size(image_paint);

image_x = image_size(1);

image_y = image_size(2);

size_check = size(image_size);

if(size_check(1, 2) > 2)

image_paint = rgb2gray(image_paint);

end

image_bin = imbinarize(image_paint, 'adaptive', 'ForegroundPolarity', 'dark', 'Sensitivity', 0.5);

SE1 = strel('line',6, 180);

SE2 = strel('line',2, 90);

SE3 = strel('line',7, 90);

image_erode = imerode(image_bin, SE2);

image_dilate = imdilate(image_erode, SE1);

image_dilate = imdilate(image_dilate, SE3);

median_result = median(image_dilate, image_x, image_y);

mean_result = mean(image_dilate, image_x, image_y);

figure;

subplot(1,2,1), imshow(image_raw);

title('image raw');

subplot(1,2,2), imshow(image_dilate);

title('image result');
result: